

Predictive Analytics: Predictive Revenue for Every Business
Expertise in the performance drivers at each step of the customer journey is indispensable to ascending from descriptive analytics, where teams are able to manually identify traditional metrics of the organization, to predictive analytics, where these metrics are used to determine or inform future outcomes. The competitive edge in business today is found in the quantifiable variables of a finely-tuned analytical model. Using data to understand customer interactions across all touch points within the business, and the influencers and drivers that affect each, is the domain of Business Analytics (BA) and a keystone example is the Predictive Revenue Model.
Business Analytics is the methodical collecting, sorting, processing of business data to gain new insights, and enables an ever-expanding field of knowledge and practices driving performance.
While early Business Intelligence (BI) used statistical analysis of raw data to explain past performance to stakeholders (descriptive), later analytical models combined historical data with rules, algorithms, and additional (sometimes external) data to identify future performance (predictive) and the actions favorable to specific outcomes (prescriptive).
“The field is now evolving toward business-wide embedded analytics, enabling data analysis at critical points of the workflow in real-time.”
In other words, analytics can describe details of past performance, explain why the business performed this way, what future performance to expect, and finally, what the leadership can do to best impact performance in the future. Systematically leveraging data provides a coherent view of the business performance timeline, while enabling leadership to enact change to increase performance and reduce future risk.
The Predictive Revenue Model
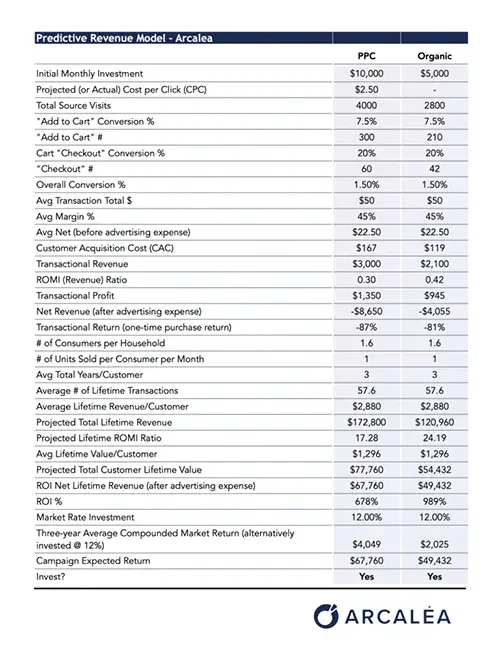
The Predictive Revenue Model is a data analytic model which uses financial, marketing, and advertising data to predict the return on advertising within multiple scenarios. Capturing the initial marketing spend, the model represents the revenue flow from customer interaction at the top of the funnel. The model leverages a relatively small but varied range of data elements and business variables and demonstrates the efficacy of predictive analytics, and its ability to delve beyond top-line data and into the Customer Journey. Two channels are used for the included example: Pay-Per-Click (PPC) and Organic.
As an example, with a minimum of the data elements below, businesses can use the Predictive Revenue Model to determine the value of specific marketing efforts.
| Company Financials | Marketing Data |
| Ad spends | “Add to cart” Leads |
| Company Margin | Checkout Conversions |
| Lifetime Value (LTV) | Transaction Total $ |
Moreover, the transferable value of the model can be leveraged to measure and predict the marketing efforts across multiple channels, product lines, customer segments, regions, campaigns, ad types, and even specific ads and offers. This provides leadership the capability to answer simple questions, including:
Where is my greatest advertising return: Google Search Ads or Display, Facebook promoted posts, or Youtube video ads?
What ad type performs best for the current product line? Showcase shopping, image ads, text ads, banner ads?
What channel is the best performing: Organic or Pay-per-Click (PPC)?
How can we achieve our revenue (and our bottom-line) targets?
The simplest analytics are available to practically any organization. Within a business’s existing data are untapped connections that can drive return from a more focused marketing effort. Basic cost/profit data combined with simple ad and customer tagging within an ad platform will ensure businesses have a clear sight of what specific marketing efforts return in profit for targeted product offerings.
As the data set, processes, and infrastructure expands in depth and maturity, more sophisticated and powerful benefits follow. The field is now evolving toward business-wide embedded analytics, enabling data analysis at critical points of the workflow in real-time. Rather than toggle between business workspace and data analytics platforms, workers access analytic content and capabilities within the native business applications at relevant decision points–an advanced Business Intelligence (BI) toolset integrated into enterprise platforms (e.g., CRM, ERP, EAS, etc.).
Data Components and the Predictive Revenue Model
Quantifying and Connecting
Business leadership benefits when data tells the financial story effectively, tying investments to returns. In the past, marketing provided total advertising spends and YOY revenue growth as a key indicators. Now, however, predictive analytics can provide detailed bottom-line revenue tied directly to specific marketing campaigns. The initial investment is input at the top of the predicted revenue model. The number of visits from ad to website (Click-through-Rate, or CTR), the number of products added to cart, and the number of completed online purchases (and values) are all captured by tagged elements in the ad platform. From this alone, basic math provides the immediate transactional return for the campaign and the acquisition cost per customer. More importantly, when those metrics are applied to calculate the Lifetime Value (LTV) of the customer, the true return on investment is apparent.
By aggregating company financials and ad platform data, key descriptive analytics insights are revealed (mapping spend to specific returns, average transaction revenue, etc.), as well as revenue-producing predictive analytics insights (a known Cost Per Acquisition can forecast revenue from future ad spends, expected campaign return for customer lifetime). The use of core data elements from ubiquitous platforms (EAS, digital ad platform, and, optionally, a CDP/CRMM) provides the key elements required for marketing leadership to greatly enhance decision-making.
Learning the power of the existing data, the relative simplicity of new data elements, and the logical connectivity between them, all provide transparency to drivers of business performance, and the insights to greatly enhance decision-making at nearly every level.
Business Financial Data
Most C-level employees are familiar with business financial data elements, as many recurring meetings and reports focus on revenue targets and profitability, often by channel, product lines, and new initiatives. The data sources may be routine: the EAS for most, with smaller specialized databases or spreadsheets for new, one-off, specialized or legacy accounting initiatives and tasks. However, this core data is critical in revenue prediction–it forms required baselines (average margin), or combines with marketing data to calculate new values (average margin of average “checkout” conversion, campaign average net transaction value). Below are the primary business financial data elements most relevant to the model.
Business Financial Data (Dependent on Financial Platform)
| Initial Investment | Total investment in advertising over a specific time frame for a channel or product (PPC), and the total (Organic). |
| Revenue | Company revenue (total or product specific). Used to calculate margin. |
| Costs | Company costs (total or product-specific). Used to calculate margin. |
| Margin | Profit (either gross, operational, or net). Calculation from accounting platform data. |
| ROMI | Return on Marketing Investment. The contribution to profit attributable to advertising. Calculation from accounting and advertising platform data. |
| LTV, LTR, Lifetime Transactions | Lifetime projections (of Value, Revenue, or Transactions) are calculated based on projected number of purchases/transactions over a specific time period. These calculations may be sourced from large volumes of historical data in a CDP/CRM, EAS, or contractual data from a SaaS agreement, but is also driven by each specific business model. |
| COGS | Cost of Goods Sold. Expenses directly related to creation of product. Calculation from accounting platform. |
| SG&A | Selling, General & Administrative. Non-production expenses. Calculation from accounting platform. |
| CAC | Customer Acquisition Cost. The initial cost to attract a customer (one who completes a transaction). Calculation from accounting and ad platforms. |
Using Business Financial Data in the Predictive Revenue Model
Core business financial data (i.e., sourced from the EAS or system of record) required for the Predictive Revenue Model is little more than costs and revenue. Combining these basic data elements with ad and customer data, the remaining values can be easily calculated or segmented.
Initial Investment is simply the cost incurred to advertise (or facilitate organic traffic) in a channel for any product(s) for which you are predicting revenue. This cost is applied near the midpoint of the model to calculate ROMI (Return on Marketing Investment) by dividing the Transactional Revenue by the Initial Investment to create the ROMI Ratio.
Revenue and costs are used to calculate the margin, or profit, for the company. The company margin is used to calculate the profit from each “Checkout” conversion (Avg Net). At its most basic level, margin is a simple formula of costs subtracted from revenue, usually expressed as a percentage. However, determining which costs to include (e.g., COGS, SG&A, CAC) can vary depending on company strategy, context, and even cost complexity. For the purposes of this model, only a consistent calculation is required.
While overall company revenue is used to calculate an average margin, specific product revenue is used to determine average transaction value and average net revenue value (before subtracting advertising investment).
The ROMI value is calculated by subtracting initial investment from Projected Total Customer Lifetime Value (net), leaving a true return against the ad spend (ROI Net Lifetime Revenue). The ROMI prediction for an ad campaign compared to a market rate return provides the clearest indicator if the proposed marketing initiative is viable. Because the LTV window is 3 years in this model, the Market Rate is likewise compounded over 3 years.
Lifetime Values — The art and science of this prediction can vary widely, as noted above. In the model’s sample data, a 3-year window was used while transactions were based on standardized metrics.
The financial data points used for model input must be as specific as the analytics questions the model is used to answer. In this case, the Initial Investment was tracked separately for 2 channels, predicting separate revenue and ROMI for each. In the sample data, investment in Organic had the highest ROMI percentage. Other factors which which also may normally differ between the two models, have been standardized for the sake of comparison.
Customer and Marketing Data
Outside of marketing departments, detailed customer and marketing data may be less familiar to business leaders than traditional financials. Cost per Click (CPC), micro-conversions, Pay per Click (PPC)–all are dissimilar to typical bottom line discussion points. The data sources are the various digital ad platforms (Google Ads, Facebook Manager, etc.) and ideally a Customer Data Platform (CDP) or Customer Relationship Management (CRM) system for data that can help build Lifetime Values. These data elements quantify marketing campaign costs and outputs, whether it’s the number of “checkout” conversions or “add to cart” micro-conversions during a campaign. Below are the primary customer and marketing data elements most relevant to the example model (and may change depending on the product, service, or platform)
Customer and Advertising Data (Dependent on Customer/Ad Platforms)
| Cost per Click (CPC) | The CPC is typically calculated by the platform, but can easily be projected by established industry standards. A “click” is anytime a visitor clicks a campaign ad and is forwarded to the product website. |
| Site Visits | Number of times an ad is clicked and a visitor is passed to the website. |
| “Add to Cart” Conversions | Number of site visits which added product to cart. Expressed as raw count or percentage of site visits that “add to cart.” |
| Cart “Checkout” Conversions | Number of “add to cart” that completed the transaction at “Checkout.” Expressed as raw count, or percentage of “add to cart” that completes “Checkout” transaction. |
| Average Transaction Total | Average value in dollars per transaction. Calculation from ad data. |
| LTV, LTR, Lifetime Transactions* | Lifetime projections (of Value, Revenue, or Transactions) are calculated values based on projected number of purchases/transactions over a specific time period. These calculations may be sourced from large volumes of historical data in a CDP/CRM EAS, contractual data from a SaaS agreement, but is also driven by each specific business model. |
*Note: Some data values may be found in both systems due to shared generation of data element and/or value.
Using Customer and Advertising Data in the Predictive Revenue Model
Customer interaction data (sourced from the ad and customer platforms) required for the Predictive Revenue Model includes all key touch points that combine with financial data to quantify the marketing initiative results, as well as historical profile data usually found in a CDP/CRM.
Cost per Click (CPC) is a platform depending advertising cost based on a charge for each instance a campaign ad is clicked by a visitor. As in the example for the Amazon channel, 2000 clicks cost $10,000. The CPC expense is used to calculate ROMI or “true” overall return on marketing investment.
Site visits captures the number of times a potential customer clicks an advertisement to land on the company website. Each visitor that adds a product to the shopping cart, registers as an “Add to Cart” Conversion, and could be considered a lead for this model. A prospect becomes a customer when he or she completes a purchase, and a Cart “Checkout” Conversion is recorded. In this way, the raw numbers of visits, leads, and purchases are recorded relative to a specific advertising campaign, and correspondingly, calculate the percent of visits that become leads and the percent that become sales or customers. In the model’s sample data, the conversion rate of 1.5% is a predictive value for future advertising that follows the specifications of the existing campaign.
Customer Lifetime Data (LTV, LTR, Lifetime Transactions) can be based on a wide range of variables depending on the product or service, business model, and even strategic planning of the organization. Generally, LTV is a function of the average expected number of customer transactions, multiplied by the average value per transaction (the net profit attributed to the lifetime of the customer, vs revenue which is LTR). As noted above, the sources include multiple databases, and the aggregated data elements–financial data, customer profiles, segments, interaction data, contracts–can each impact the calculation. Finally, the value assigned to Lifetime Transactions in the model is a simple average of all customer transactions.
As with financial data, the relative specificity of customer and marketing data should match the predictive output data sought. In order to determine which ad type performs best, data would be tagged by ad type (video, banner ad, text ad, shopping ad, etc.). To identify customers most likely to convert, customer segments would be tagged (e.g., by demographic parameters, remarketing status, number of “add to carts” before checkout, etc.).
Model-Generated Data Elements
Many values in the model are generated from the model itself, and are based on inputs from the prior data sources, or built on calculated results from those sources.
Calculated Values (Model-Generated Data Elements)
| Avg Transaction Total | The average $ per transaction |
| Avg Net (before ad expense) | The average margin or profit $ from each transaction |
| Customer Acquisition Cost (CAC) | Investment divided by number of customers |
| Transactional Revenue | Calculated revenue $ on single purchase transactions |
| ROMI (Revenue) Ratio | Total Transactional Revenue / Investment |
| Transactional Profit | Transactional Revenue multiplied by Margin rate (45%) |
| Net Revenue (after advertising expense) | Calculated profit $ on all transactions after advertising |
| Avg LTR/Customer | Based on marketing research on consumers/household and consumption, over 3 years |
| Projected Total LTR | Calculated total avg LTR multiplied by number of transactions |
| Projected LT ROMI Ratio | Calculated LT ROMI (Total LTR/ Investment) |
| Avg LTV/Customer | Avg Net/customer (before ad expense) multiplied by avg # LT Transactions |
| Projected Total Customer LTV | Total Customers multiplied by Avg LTV |
| ROI Net LTR (after advertising) | Return on overall investment (Total Customer Net Rev – Investment) |
| ROI % | ROMI as percentage |
Model-Generated Values in the Predictive Revenue Model
Data elements generated within the tool are not supplied by the original data sources; instead, these values are computations based on the original data sources, or on calculations of these sources. Understanding the basis and meaning of the calculations is a necessary part of tool use, and enables extrapolation to additional values beyond revenue prediction.
Avg Transaction Total is calculated from the individual totals of all Cart “Checkout” Conversions, creating a handy metric useful in computing transaction level data when transactions are unequal among the unique customer purchases. A good example is the Avg Net (before advertising expense); the value uses a standardized transaction average before applying the standard company margin percent.
Transactional Revenue calculates the total revenue $ for all “Checkout” transactions, and then translates the revenue into a ROMI (Revenue) Ratio, or % return from investment. Similarly, Transactional Profit calculates the total return based on margin (and before ad expenses). Finally, with Net Revenue (after ad expense) the total margin return deducts the Initial Investment (revealing a loss in the sample data).
The remainder of the values in this group relate to Lifetime projections, from the spends of an individual customer over the designated 3-year timeframe (Avg LTR/Customer); the Projected Total LTR, the prior value multiplied by all the transactions; Projected Lifetime ROMI Ratio, or return rate for the initial investment against all revenue (Revenue/Investment); the Avg LTV/Customer or margin or profit per customer; the Projected Total Customer LTV, or the LTV added for all customer transactions; and finally the ROI Net LTR (after ad expense) to calculate the overall LT net profit after margin and investment; the ROI/ROMI expresses this as a percentage.
Market Rate Investment vs Campaign Expected Return: Invest?
One way to gauge the success of business investment is to compare the campaign return, not with the initial investment, but with the return of a reference investment baseline, such as a compounded market return (here we use a standard market rate of 12%). Of course, the model could accommodate other ROMI baselines as well: opportunity costs, soft costs (staff hours logged against the campaign), or other industry specific quantified comparisons. As shown in the case of the sample data, return for each of the two channels far exceeded the baseline.
| Organic | PPC | |
| $10,000 | $5,000 | |
| Market Rate Investment | 12% | 12% |
| 3-year Avg Compounded Market Return | $4,049 | $2,025 |
| Campaign Expected Return | $67,760 | $49,432 |
Some marketing campaigns with large initial investments and low cost non-luxury products do not initially achieve positive returns due to high Customer Acquisition Costs (CAC). Such businesses understand that over the medium and long-term, (and based on historical data) customer, average returns outpace these losses in the LTV time horizon. However, because the flexibility of the model accommodates different LTV timelines, revenue predictions include future windows broad enough to pinpoint when even lower-priced goods begin to return.

The Marketing CRM
The marketing-focused CRM captures every interaction, preference, history of the customer analyzes volumes of historical ...
Predicted Revenue Model Walkthrough
Included is a walkthrough of the Predictive Revenue Model, split into three main parts:
- Investment to Conversion (Top of funnel, decision to advertise or invest resources in organic to conversion)
- Average Transaction to Return (Revenue, Margins, and ROMI)
- Average Lifetime (LT) Transactions to Campaign Expected Return (LTVs calculated to total return)
Finally, the model ends with an investment decision based on the revenue prediction output.
Investment to Conversion
| Initial Investment (Monthly) | PPC | Organic |
| Projected (or Actual) Cost per Click (CPC) | $10,000 | $5,000 |
| Total Source Visits | 4000 | 2800 |
| “Add to Cart” Conversion % | 7.5 | 7.5 |
| “Add to Cart” Conversion # | 300 | 210 |
| Cart “Checkout” # Conversion % | 20% | 20% |
| “Checkout” # | 60 | 42 |
| Overall Conversion % | 1.5% | 1.5% |
Of 4000 PPC ad clicks, 1.5% or 60 completed a purchase.
Whether calculating return on a PPC or Organic, the model starts with the input investment. In the case of PPC advertising, the company invests $10,000 budget for a month of online advertising; for Organic, $5,000 is invested in SEO (techniques to increase website standings such as developing content, optimizing load times and mobile readiness, modifying landing page experience, implementing changes to drive sitelinks, backlinks, etc.). The tangible metric from the PPC investment is represented by the Cost per Click (CPC), and in the total costs incurred for Organic optimization. While the CPC rate is driven by fluid factors (ad relevance, landing page experience, competitiveness of auction, context of a person’s search), the input here can be historical, or projected. Each time a visitor clicks a campaign ad, the user clicks through to the targeted landing page, the total of which is represented by Total Source Visits. Note: these first 3 values correlate in that if you know 2 you can predict the 3rd.
The rest of this section captures several conversion-related data elements. Of the total source visits, a small percentage “Add to Cart” a product or service, and a yet smaller percentage complete the purchase or “checkout.” Entering the number of “add to cart” micro-conversions and the number of “Checkout” conversions, the Overall Conversion Rate is determined. In this example, of the 4000 ad clicks through to site, 1.5% converted to a customer or sale.
Predictive Revenue: Average Transaction to Return
| PPC | Organic | |
| Avg Transaction Total $ | $50 | $50 |
| Avg Margin % | 45% | 45% |
| Avg Net (before advertising expense) | $22.50 | $22.50 |
| Customer Acquisition Cost (CAC) | $167 | $119 |
| Transactional Revenue | $3,000 | $2,100 |
| ROMI (Revenue) Ratio | .30 | .42 |
| Transactional Profit | $1,350 | $945 |
| Net Revenue (after advertising expense) | -$8,650 | -$4,055 |
| Transactional Return (one-time purchase return) | -87% | -81% |
While the immediate return may represent a loss, ultimately the initial investment will be dwarfed by a LTV of even a few years.
In the immediate transaction section of the model, two new inputs drive different expressions of the investment return. The Avg Transaction Total (average of actual purchases) and company Avg Margin combine to generate the Avg Net per transaction. The Customer Acquisition Cost (CAC) is the initial investment divided by the number of customer transactions* during the investment period. Transactional Revenue is the average transaction total multiplied by the number of transactions (for PPC, 60 x $50), while the corresponding Transactional Profit is the average net multiplied by the number of transactions (for PPC, 60 x $22.50). The ROMI to Revenue Ratio is a calculation representing the factor of return for investment spends–in the PPC example, every dollar spent returned 30 cents gross. Profit after advertising expense is computed in the Net Revenue in dollars, and the Return rate as a percent.
Note: The cost of customer acquisition (CAC) is a key metric, and one that future profits is measured against. While a company may have a solid customer base, reward programs, validated churn indicators, and extensive feedback mechanisms, the importance of acquiring and keeping new customers for the exponentially impactful LTV is clear.
Market Research Data
| PPC | Organic | |
| Number of Consumers per Household | 1.6 | 1.6 |
| Number of Units per Consumer per Month | 1 | 1 |
| Avg Total Years per Consumer | 3 | 3 |
Robust data models can have many data sources to aggregate and create a [structure] comprehensive enough to quantify and predict [esoteric] [and even long-term] values. In this model, market research helps calculate the customer LTV (Lifetime Value), a projected profit return from an initial investment and/or customer acquisition. In this case, the first value above represents multiple research conclusions on consumers per household; the second value is historical; finally, the Avg Total Years/Customer is a combination of historical data, trends, forecasts, and company strategy. As noted above, LTVs are calculated with a wide range of variables, and depend greatly on the strategies, goals, and offerings of each company.
Average Lifetime (LT) Transactions to Campaign Expected Return
| PPC | Organic | |
| Average # of Lifetime Transactions | 57.6 | 57.6 |
| Average Lifetime Revenue/Customer | $2,880 | $2,880 |
| Projected Total Lifetime Revenue | $172,800 | $120,960 |
| Projected Lifetime ROMI Ratio | 17.28 | 24.19 |
| Projected Total Customer Lifetime Value | $1,296 | $1,296 |
| ROI Net Lifetime Revenue (after advertising expense) | $77,760 | $54,432 |
| ROI % | 678% | 989% |
| Market Rate Investment | 12.00% | 12.00% |
| Three-year Average Compounded Market Return (alternatively invested @ 12%) | $4,049 | $2,025 |
| Campaign Expected Return | $67,760 | $49,432 |
| Invest? | Yes | Yes |
Rather than comparing expected return with initial investment, a fairer comparison metric is Compounded Market Return.
In the final section of the model, the LTVs (Avg Total Years, Transactions) are combined with prior revenue calculations to predict Campaign Expected Return, the ultimate expression of value to compare with initial investment, other investment opportunities, and even other sales and marketing channels.
Using the previous market research, the calculated Avg LT Transactions (consumers/household * units consumed/month * months) is multiplied by the earlier avg transaction value to calculate the Avg LT Revenue/Customer, and, applying the 45% avg margin, the Avg LT Value/Customer. From this data, the model calculates the Projected Total Lifetime Revenue (Avg LT Revenue * # of customers), the Projected Lifetime ROMI Ratio (Projected Total Lifetime Revenue / Investment). Finally, the ROI Net Lifetime Revenue, the total return of all customers acquired during the initial investment period and projected over the 3-year window LT window, is also reflected in ROI %, and the Campaign Expected Return.
Finally, while this return intrinsically compares with the investment (678% and 989% respectively), other indicators prove useful as measurement indices beyond a simple comparison with investment costs. One standard is an Average Compounded Market Return (12%) and is used in the model. It is also possible to assign value to other incurred costs, both hard and soft, to create a higher and more complex cost for comparison. Indeed, calculating cost in order to accurately convey the bottom line can be more involved.
Using the Predictive Revenue Model: Use Case to Calculate Quota Attainment
One example of how Marketing and Sales can leverage this framework is calculating quota attainment. Assume Jerriswholesale.com has been running ad campaigns for six months, and has established an average number of closed deals of 48 deals/month. However, new quarterly goals have been set, and quota attainment is now set at 60 deals/month. Fortunately, because of infrastructure which includes attribution, and consistent historical data, Jerris can easily update selected input variables (average conversion rate and investment inputs) to quickly establish the necessary changes which will produce the requisite outcome. Here, given an average historical Cost Per Click, add to cart and final checkout figures, increasing spend to $61,500 is the projected input required to produce 60 units sold. The resulting new table is shown here:
| Prior 6 Months | Modification for Quota | ||
| Media Spend | $50,000 | Media Spend | $61,500 |
| CPC | $13.00 | CPC | $13.00 |
| Users Clicked | 3846 | Users Clicked | 4731 |
| % Cart Conversion | 3.4% | % Cart Conversion | 3.4% |
| Users Added to Cart | 131 | Users Added to Cart | 161 |
| % Checkout | 37% | % Checkout | 37% |
| # Sold | 48 | # Sold | 60 |
(Note: there are additional calculations which establish spend latitude which would more accurately establish 95% probability of achieving 60 units sold, which we cover in another post)
Changing the input variable until the checkout conversion reaches quota takes seconds. Cost per acquisition (CPA) remains constant. The investment change increases the pool of site visits which convert at the same rate as before, now closing 60 deals for the month.

Data Science Maturity Models (DSMMs): A Broad Consensus Composite
The majority of Data Science Maturity Models (DSMMs) reviewed cover 4-5 levels with outliers reaching 6 ...
Benefits from the Predictive Revenue Model
The prominent benefit of the Predictive Revenue Model is its namesake–predicting revenue. The ability to compare multiple channels, and a long list of variables for each, makes the tool versatile and flexible.
A good analytic model is portable, i.e., it can accept small changes to create “new” models in which input points support variations of the planned datasets, or even fundamentally different data points from similar or disparate fields and functions. The sample data already shows the ability to compare channel performance (i.e., PPC, Organic). However, the investment inputs at the top of the model support various dimensions that track separately, predicting performance of different components in the marketing campaign, and potentially other elements within the overall business cycle. As noted above, the investment channels could expand to include additional digital ad options such as Google Display, YouTube, Facebook, etc.
If the input values were investment in each ad type or ad group, the data could answer additional marketing questions, respectively:
- Which ad type performed better long term?
- Which ad group reached a positive return fastest?
Ad investment by customer segment could answer:
- Which customer profile is most likely to convert in 30 days?
- Do repeat customers average higher revenue per transaction than new customers?
The drill-downs provided by investment segmentation are rich in planning opportunities, enabling high-performance combinations of marketing strategies, customer targets, and ad combinations.
Expanding the model between site visits and “add to cart” provides opportunities for Conversion Optimization (tweaking the top of funnel) by mining additional steps in the customer journey: How much time is spent before “add to cart”? How many pages are visited on average before “bounce” or conversion? Which are the top pages visited prior to conversion? This data can identify needed modifications to the landing page, specific product pages, even keyword additions/removals to increase percent overall conversion. Just increasing overall PPC conversion from 1.5% to 2.0% moves the return from $67,760 to $93,680 for the channel. Doubling overall conversion to just 3% returns $145,520.
While top of funnel optimization may be obvious, analyzing variables post-conversion can uncover drivers impacting LTV, an indicator that truly functions as a profit multiplier. Determining loyalty drivers from analyzing customer service data (first 60 days, second year, etc.), social media posts, and market research for brand changes–all can refine the calculation accuracy and impact LTV drivers increasing the value.
Other benefits revealed through similar predictive data structures and models:
- Identify which products perform best in different channels, scenarios, by tracking products instead of ad type or channel.
- Forecast inventory and manage resources.
- Determine which new product should receive investment.
- Recognize and prepare for trends by reviewing analytics spanning longer time periods for indicators relating to business threats or advantages.
- React to predicted events before they occur.
- Remove bottlenecks and customer drop-off in the top of the funnel.
- Qualify leads with high-converting customer attributes.
- Optimize all parts of an integrated marketing campaign.
- Open up new revenue streams with products meeting a need identified by predictive analytics.
- Predict and stop customer churn by using historical data to identify risk attributes.
- Use the model to modify the product cycle (e.g., Conversion Optimization)
- Use the product cycle data to modify the model (tuning the model).
Toward a Data-Driven Environment
Using tools like the Predictive Revenue Model require little investment in BI/BA–but the experience should awaken a sense of what is possible with data. Transitioning to a more data-driven business model requires a broad set of Business Intelligence and Analytics enabling capabilities–data access, tagging/attribution, data aggregation and preparation, and data modeling. With each of these capabilities comes an abundance of options, and an opportunity to choose infrastructure components that best match the business structure and need.
“Likely less than 5% of the world’s data is analyzed, while it’s estimated that about 20% of existing data could be useful if tagged and analyzed.”
At one point, Business Intelligence was the domain of IT, and the output was a static one-dimensional report that took days to compile. With the advent of self-serve BI tools, and more recently, automated and augmented BI tools that blur the line between BI and BA, the possibilities have never been greater. Now is the time to engage the data, learn the business’ data sources, both structured and unstructured, and the tools required for aggregating and preparing. Understand the minimum data tagging necessary to make the company data discoverable when it’s needed. Experiment with attribution modeling and the company data and determine which models provide different benefits, and ensure that each contributing event in the customer journey is assigned appropriate value in the model. Build data models that are repeatable, deploy without disruption, and maintain security and compliance for sensitive data. Find an experienced partner who provides transparent guidance tailored to the business structure and strategies.
Likely less than 5% of the world’s data is analyzed, while it’s estimated that about 20% of existing data could be useful if tagged and analyzed. The data-driven business leader can identify the data most likely to provide high-impact actionable value, leverage existing tools and models, find trusted data partners, and discover modifiable drivers throughout the business life cycle. Those who do will grow their offerings, customer base, and business.
Appendix: Predictive Revenue Model
*For the purposes of this example, each transaction is assumed to be a unique customer.


RESPONSES