

Competitive Analysis of Market Positioning
Purpose of the QMA
Businesses have long valued competitive intelligence. By definition, from product design, to strategic planning, marketing is dependent upon competition and competitive forces, and entering or succeeding in any market, requires understanding the competition. From target market and the core value propositions, to product-market fit, services, brand, pricing, market opportunities for differentiation and value creation: all require competitive intelligence and a frame of reference. Today, especially in a COVID world, the primary interaction with brands is online. In fact, most B2B and B2C journeys occur almost entirely online. And so to understand a brand’s position in-market, and areas of opportunity, the tangible assets can be benchmarked and analyzed for comparison. This can be measured to comprehensively contextualize a business’s functional opportunities. During the Quantitative Marketing Assessment (QMA), data from nearly all of a businesses’ interrelated business dimensions is gathered and benchmarked, informing decisions from goal and strategy definition, to tactical design and implementation moving forward.
A business cannot operate successfully without understanding its position in the market.
While traditional competitive data provide good but isolated value, the full situational landscape afforded by a detailed analysis of positioning in the market of a business and its competitors is invaluable–and mandatory–to understanding a business’s situational context in the market. Only then can a business begin to fully align the multitudes of dimensions and indicators that create superior value in the marketplace.
Strategic Market Context
While the QMA evaluates dozens of dimensions to define a business’s position in the competitive marketplace, this context must be connected to the full business marketing strategy to create an aligned impact. Then QMA insights inform the interrelated strategic goals and tactics that are required to successfully design and deliver an offering in the market.
An initiative’s tactics are uniquely informed by strategy. An initiative’s goal, is realized by the strategy which articulates the target market and defines the value proposition based on the target need. The QMA that contextualizes the business in the marketplace validates the business’s ability to deliver the value proposition to the targeted market audience, or uncovers market insights that require a business to modify the strategy–or modify market factors currently impacting the strategy. In any instance, all components of business strategy depend on understanding competitive market position.

Marketing Strategic Planning
Using a Framework to Achieve Goals The Value of Marketing Plans Cecilia’s Coffee Bean ...
Assessment Dimensions
The QMA is a dual analysis tool, focusing on the business’s consumer-facing posture, and that of its top competitors. While each business requires different points and degrees of focus, much of the assessment centers on areas common to businesses operating in a digital landscape. Typical dimensions include Brand Awareness, Digital Portfolio Health (core site traffic and page-level analytics, and paid advertising), Search Engine Optimization (keyword distribution, local SEO, technical SEO), e-commerce (Retail.com and/or Amazon Marketplace), and the User Experience (Information Architecture, site visitor behavior, and the Consumer Journey) among others.
Just as a business’s market position and strategic initiatives can, at a minimum, influence one another, the elements of the assessed dimensions interrelate, and can collectively be used to improve metrics across all dimensions.
Brand Awareness
Because brand awareness can vary depending on the market, DMA, or region, brand strength can have a significant impact on the efforts and expense required to achieve marketing goals. As a result, the deployment tactics in one region may leverage a level of brand awareness that may not exist in others, leading to regional variation in cost and efficiency. Conducting primary market research determines market-specific levels of brand strength, which are then useful in defining the strategic and tactical implementation, including resource requirements and the tactical marketing mix. Level of awareness can also directly affect financial resources and tactical implementation required to achieve a business goal.
Aided and Unaided Awareness
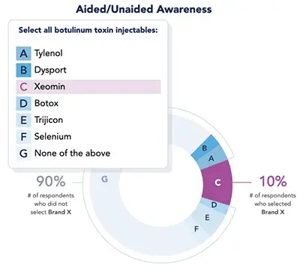
Brand awareness is estimated by using sample sizes large enough to attain a 99% confidence level and 5% margin of error. In an unaided awareness assessment, respondents are provided a list of brands and must identify which ones belong to a particular product or service type (eg., “Select all soft drink brands from the following list”). In an aided awareness survey, respondents are given the target brand name and asked to identify its product or service type (e.g., “NeoSpice is a (a) vegan food brand, (b) aftershave brand”, etc.)
Identifying relative brand strength in potential target areas can reveal optimum resources required for a market, or where a business may need to apply tactics for raising brand awareness, such as targeted content development that demonstrates expertise, or launching less expensive or freeware product versions, with premium or enterprise versions offered for different pricing. Conversely, target areas in which competitors maintain high brand awareness may be too costly for immediate entry.
Digital Portfolio Health
The purpose of a healthy digital portfolio is to facilitate effective collection of digital data–data that helps answer questions that stakeholders use to effectively allocate the marketing budget to meet business goals.
Technology Stack Fingerprint
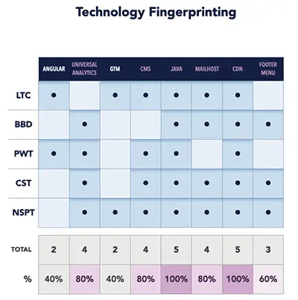
New technology is continuously available to the market. Competitors who deploy successful advanced technology may achieve a competitive advantage until competition adapts. Understanding the technology utilized by competitors can reduce competitive advantage and shorten time to adapt to the changing martech landscape. Analyzing certain employed technologies (new language frameworks recently installed on web platforms, for example), may provide insight and early signals into competitive initiatives or movement.
Insights into competitor’s current technology use is measured by fingerprinting the core web stack. As a result, a business can evaluate the competitor’s current deployed tech including their analytics and tracking tools, frameworks, advertising platforms, content management system, hosting providers, javascript libraries and more.
Search Reputation Management (SRM)
Search Reputation Management (SRM) refers to oversight of the Search Engine Results Page (SERP) for the branded search of a company. SRM is critical in influencing audience perception of a business or brand. The first page of the Search Engine Results Pages (SERPs) returns only 10 results, the top three of which receive the majority of traffic. As these listings receive the highest clickthrough rates (CTR) of all search results, the CTR of the fourth position within the SERP decreases to approximately 5%, giving this listing (and all other listings after) less than 5% of the available traffic, underscoring the importance of SERP management for a brand.
Analyzing the SRM for a brand and its key competitors includes assessing the presence of features and factors that can maximize the amount of positive and relevant results. SRM parameters include paid and organic results on a SERP, sitelinks and featured snippets, knowledge panels (branded or local), profile links, and other SERP features such as “People also searched for” panels. The primary goal of SRM is to ensure that users are served up with the most brand relevant and beneficial results. The quantitative assessment identifies the business and its top competitors utilization of SERP features, as well as their gaps.
Digital Platform Configuration
Companies using data-driven decision-making depend on timely, accurate, and complete data capture to make informed decisions. A prerequisite for data capture and management remains the correct configuration of core digital tracking and data management utilities–Google Tag Manager (GTM), Google Search Console (GSC), and Google Analytics (GA).
Google Tag Manager (GTM) can be thought of as the control center for website tags, allowing brands to effectively and correctly implement and control tracking. Google Search Console (GSC) tools and reports help measure brand site performance on the Search Engine Results Page. Google Analytics (GA) is the ultimate data hub that tracks and stores all traffic, conversion, and user experience data for the brand’s website.
Setting up GTM and GSC to feed data into GA provides a 360-degree view of a website’s performance. The properly configured combination of these platforms ensures insight into the number of visitors, traffic channels, time spent on site, and even the completion of goals (conversions) and sub-goals (mini-conversions).
Google Analytics Data Analysis
As the hub for user online activity data, and when set up correctly, core site analytics, often Google Analytics (GA), is one of the most important brand tools. As part of the QMA, GA provides critical data about a business’s audience and page-level performance leading to actionable insights for competitive advantage. GA’s audience analysis reveals traffic origins for customer acquisition, customer behavior from each channel, and where a business focus should be applied for greatest return. Stakeholders learn which channel contributes the most conversions, which provides the most organic traffic, the comparative strength of a referral campaign, and how long visitors from each channel spend on the website. GA’s page-level data analytics identify the pages with highest visitations, most conversions, or most organic visitors.
GA data insights can identify opportunities such as adding micro-conversions to better follow the conversion path, or Consumer Journey, tuning the advertising mix if, for example, the Display Ads deliver high traffic volume but low session duration, or modify content on a page with high entry visitation but low conversions.

Google Analytics 4
Preparing for the Future Now Executive Summary Google Analytics 4 (GA4) is a fundamental reinvention of ...
Paid Advertising
While paid advertising is a powerful way to raise brand awareness, it should be tactically employed to generate short-term results for either intent-based search pay-per-click (PPC) or used in brand awareness or remarketing/retargeting in display advertising. With the proper configuration, paid advertising can efficiently increase revenue for a brand. However, effectively managing online advertising depends on several interrelated dimensions, such as SEO, on-page content, Consumer Journey, as well as the parameters within the ad platform itself–Quality Score, Ad Rank, targeting, Google Ads extensions, and bidding strategy.
An analysis should include these dimensions and platform parameters for a business’s current ad accounts, and those of key competitors where accessible.
Analyzing these dimensions and parameters identifies which need adding or adjusting to maximize return. Analyzing internal metrics tracked within the ad platform, such as Impression Share (IS) and Cost-per-Acquisition (CPA) provides ad performance insights that lead to actions that aim to capture conversions lost through low IS, or changing bidding strategy to capitalize on a lower CPA.
Search Engine Optimization (SEO)
Search Engine Optimization (SEO) is used to improve a brand’s organic rankings and subsequent organic traffic. The goal of SEO is to create or modify elements that influence the way search engines interact with a business website and all of its pages. However, because SEO is dynamic, it is often insufficiently deployed or maintained, reducing crawlability, indexability, and ranking of site, page, and keyword.
As a result, organic traffic and revenue decrease, but the cost of acquisition through paid channels increases. Considerations for SEO analysis include keyword distribution (and its drivers), technical website elements, site authority indicators (links, referring domains), page content, and specific local SEO indicators.
SEO research is performed to measure the technical search posture of the business primary domain and those of market competitors across these key dimensions.
Keyword Distribution
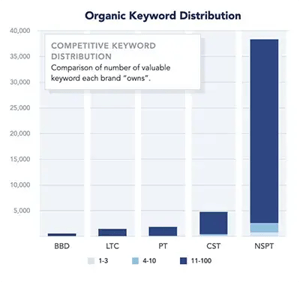
Organic keywords are one of the greatest drivers of online traffic–challenger brands are able to take advantage of high-volume contextual keywords to capture visitors to the site. When a brand’s website features comprehensive industry-relevant on-page content, the domain is able to gain relevance in Google’s algorithm. When this content is paired with authoritative links, the brand is able to “graduate” the domain’s known keywords from low SERP positions to those higher that command a greater click-through-rate (CTR).
Assessment of keyword distribution compares organic traffic and number of keywords by page type (e.g., About Us, Homepage, Products, etc.), and provides insight on where content, keywords, and CTAs should be focused. Competitive keyword distribution provides a breakdown on the number of high-value keywords each competitor brand owns (ranks). Increasing the number of high-value keywords that rank for a domain requires implementing focused on-page relevant content, and a backlink acquisition strategy to increase authority for the relevant content pages.
National SEO
The goal of national SEO is to improve on-page and off-page factors in Google’s algorithm to increase a brand’s digital relevance and authority. Digital relevance is established by the number and distribution of keywords a domain is known to Google for, while authority is established through the number and quality of referring domains a domain receives. Thus, brands are able to bolster their national search ranking and organic traffic through strategic hub-and-spoke content marketing based on keyword opportunity and relevant link acquisition. In addition to domain relevance and authority, technical on-page factors also bear implications on crawler and user experience, both of which are considerations in the national SEO algorithm.
Domain Profile
A domain profile reflects its rating and includes current Click-through-Rate (CTR) for branded and unbranded results at different positions on the SERP, and the domain authority which is primarily based on the quantity and quality of links it receives via backlinks and referring domains. Similarly, the authority of the referring domains which backlink to a referred domain is the critical factor creating value for the backlinks. Quantitative analysis verifies referring domain monthly growth and the domain rating.
Share of Voice
For any search topic a “market search volume” is defined by the total search volume for a representative sample of relevant, national keywords. The Share of Voice (SOV) of any brand is the percent of total potential search volume that brand controls. For any business, the SOV for branded search volume and contextual search volume can be different.
Technical SEO
Technical on-page factors for SEO include a site’s crawlability and indexability, as well as the crawl depth, and percent of sitemap pages crawled. Quantitative analysis verifies that crawling is not impaired, or identifies issues impacting site crawl and therefore prohibiting site pages from being seen by search engines. The analysis also verifies HTTPS security implementation, site performance (speed), and identifies all SEO technical errors such as improper redirects, duplicate content, and specific 4xx and 5xx errors. Core configuration tools, such as the Google Search Console (GSC), can identify and locate errors for quick resolution. Technical SEO analysis ensures that users and search engines are able to access a site.
Local SEO
Almost half of daily Google searches are local in nature (queries contain a geographic reference), with 88% of searchers who Googled a local business via a mobile device either calling or visiting within 24 hours. While local searches have lower search volume than national searches, they are typically also lower in competition and higher in intent. Thus, it is critical for websites to be set up to rank for and receive local traffic.
The top factors in Google’s local search algorithm are location page setup, NAP (name, address, phone), citation integrity, and Google Reviews. Pursuit of local SEO can effectively grow a brand’s local share of voice (SOV) and drive traffic to the site.
Analysis of the location page (URL taxonomy, on-page content, local structured data) identifies weaknesses such as a lack of individual location pages (with unique content) for each business site, and non-standard URL structure; insufficient or missing structured data; and limited local listings and Google reviews. Competitive analysis will clarify relative strengths and weaknesses by providing insight into which areas are available for leveraging a competitive advantage–if key competitors are not employing structured data, a business can strive to capture Local Business Snippets by employing targeted structured data markup. Addressing gaps such as these will raise local search results positioning, increase local traffic, and improve click-through-rates (CTR).
Amazon Marketplace
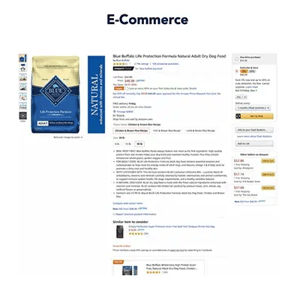
As a channel comprising nearly half of all U.S. e-commerce, the Amazon Marketplace is a significant platform for online businesses. As a robust and mature e-commerce channel, the Amazon Marketplace contains an array of dimensions controlled or influenced by the business. As a result, a competitive analysis typically uncovers numerous opportunities to improve implementation, add product listing elements, and ultimately increase market share of the target platform audience.
Amazon’s product listing anatomy includes approximately 20 different components that can raise a product and brand profile, and provide multiple methods to provide information to consumers. A QMA for a business and its competitors identifies underdeveloped or missing listing dimensions that can be added quickly or influenced over time. Answered questions, product images, reviews, enhanced brand content and other features can be added by the business, while standard ranking within a category, as well as Amazon Best Seller Rank (ABSR) are determined by sales. Businesses can update product pages for high-return dimensions such as enhanced brand content e-brochures and detailed product descriptions below the fold, or they can become a Fulfilled by Amazon (FBA) partner to increase authority and trust for the brand within the channel. Like standard ranking, the ABSR is an Amazon-calculated metric based on a product’s selling performance relative to other products in its category. Consequently, businesses should select categories and subcategories logically–a priority not only from a shopper experience perspective, but also from a search ranking perspective. If high-selling competitors are gaining sales due to organic ranking and traffic, a business opportunity may be to focus SEO for products being sold on Amazon.
User Experience
The website user experience relates to all the ways a visitor interacts with the site’s information, from the structure of the UI and each page, the path a consumer takes to reach a conversion, to the way visitors interpret information and the ways a website responds. Once paid and organic channels drive visitors to the site, content and structure of the website must drive conversions. Ultimately, all of the components play a role interacting with the visitor to create the Consumer Journey.
Information Architecture (IA)
Brand websites are often first designed with only a basic, or initial, understanding of the site visitor’s expectations and needs. The design may include a general Information Architecture (IA) and brand messaging, with positioning of key tools (menu button, search bar, etc.) and brand messaging (CTA, value proposition) based on earlier site models, or on web designers’ preferences. For these reasons and others, the original IA design should be assessed to determine optimum location of key elements above and below the fold, with the most effective conversion path designed from insights analyzing current visitor behavior. Only by assessing current user behavior (mobile, tablet, and desktop) can IA designers identify desired paths to find information and ultimately complete a purchase.
Landing Page(s) Competitive Assessment
Each time a visitor enters a page, he or she interacts with the page elements, the placement of which drives attention to key content (CTAs, product images, value proposition). A competitive analysis of landing page elements compares standard above the fold elements such as logo, menu (or primary navigation bar), search, hero image, and a “Where to Buy” call-to-action (CTA) for the business and top competitors. When a key element is missing or awkwardly placed, the user experience suffers, and the path to conversion becomes cumbersome for the consumer. If the hero image covers too much available real estate, a business may reduce it in order to reposition the “Where to Buy” CTA more prominently. If most competitors depend on secondary retail distribution channels, a business may want to prominently position their “Buy Now” CTA for their direct online sales, highlighting the reduced steps to immediate purchase. Finally, the assessment should identify any layout or structure that prevents the clear presentation of primary information upon page landing.
Click and Scroll Heatmaps
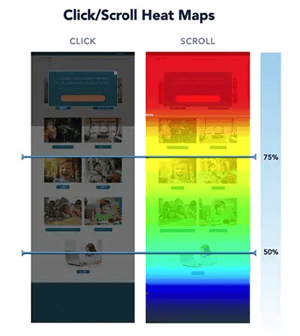
While analyzing a business’s and competitors’ website elements and their placement is critical to determining IA deficiencies and misplaced information, understanding real-world consumer behavior is better captured with click and scroll heatmaps. Heatmap analytical tools track visitor clicks and scrolls as they explore, search for information, or decide to complete a purchase.
Conducting heatmap analysis on key pages–homepage, “Where to Buy” or direct sales page, product page, store locator–on both mobile and desktop provides user data that can be compared across competitor sites to determine gaps and opportunities for enhancing user experience, increasing session time, and simplifying the path to conversion. If a link or button below the fold receives a high number of clicks, it should likely be moved above the fold so users see it when they land. If user drop-off is high after reaching the “Where to Buy” page, more analysis should be directed at the retail options listed that discourages click-through. Businesses can use the heatmap data to optimize the website and individual pages to make user intention easier to fulfill.
Most important, however, is the ability to capture the online portion of the consumer journey for the business and its competitors. Data that reveals how different customers navigate to a conversion provides insights that can lead to higher CTR, fewer drop-offs, and a more satisfying user experience. Competitor consumer journey data can inform business initiatives to increase market share at competitors’ expense.
Consumer Journey
The consumer journey, as experienced on a business website, is the complete path a visitor follows, including all touchpoints, to complete a purchase. However, the consumer journey is often fragmented, and shortest or ideal paths are not measured, documented, or known. The QMA measures the current on-page paths to conversion and analyzes the structures, content, and depth of engagement for each journey.
Attribution Modelling
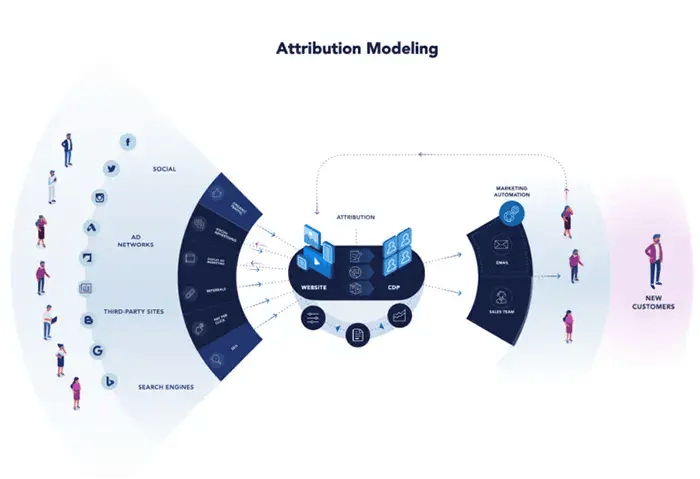
Understanding the path to conversion is critical for insights into the consumer journey, mapping alternatives, and efforts at Conversion-Rate-Optimization (CRO). Attribution is simply crediting the touchpoint that caused the sale or conversion, vital information to the marketer who is determining on which element to focus. Early attribution models focused on the Last Interaction model, assigning all the credit to the last interaction or touchpoint before purchase or conversion. However, attribution models now understand that many conversion path models exist, and a final conversion may have a half-dozen or more touchpoints before reaching the sale. As a result, more businesses use a multi-touch attribution model in which more than one touchpoint is attributed with the conversion or sale. Models vary and may provide more credit to the last few touchpoints than the first few (Time Decay Attribution), or divide credit for the conversion equally to all the touchpoints (Linear Attribution Model). Attribution models can become complex to use and capture, and businesses should select the model that aligns with their strategy. But regardless which model is used, it should be deliberate, and the touchpoints should be captured accurately.
Conversion-Rate-Optimization (CRO)
A key goal resulting from analysis of the Consumer Journey is to increase conversions. As a result, businesses employ Conversion-Rate-Optimization (CRO) techniques to increase conversions. When Google Analytics is used to analyze the Consumer Journey, tracked data reveals the entry points for the website (which page did the consumer land on first), which page elements did he or she interact with, how the consumer reached the site (from which channel traffic did they originate), basic demographic and interest information, and where did the journey stop if the consumer did not reach a purchase or conversion. Businesses use these data points in CRO activities, and can identify best entry points (or landing pages) elements, which traffic channel is most likely to convert, and what page elements cause consumers to drop off of the path to conversion. All of these elements are manageable to create data-driven conversion paths.
After capturing the journey steps, each journey is mapped to determine the variance from average customer experience and competitive experience, providing quantitative measurement for analysis. If the business median journey is 7 steps, but the top two competitors are 5 and 6, the click analysis provides modeling opportunities to reduce the path to conversion. Establishing competitive benchmarking against industry best-in-class consumer journeys allows the business to modify the consumer journey accordingly to remove barriers to conversions. Moreover, adding min-conversions to the path allows ongoing mapping and the ability to continuously improve customer acquisition.
Site Performance
Page load time is an indicator for both the user experience and search engine quality, and assessing the business and competitors provides insights for benchmarking against industry best-in-class performance. Because nearly half of a site’s visitors will wait less than 2 seconds for page load before abandoning the site, optimizing performance is critical to prevent drop-offs before visitors begin exploring the site or reach a CTA. Load time of top visited pages across mobile and desktop should be measured to compare page-level performance across critical pages. Similarly, competitors’ key page types are measured to compare CTA load time across businesses, along with all common high-priority pages such as “Where to Buy” and Store Locator. Analyzing the data can help identify specific problems that may require one or more changes: to image and video compression, overused redirects, or even server response time. While always critical to a visitor, page load time will be part of an overall user experience metric of a new Google ranking algorithm expected in 2021.
Secondary Platforms
Although it varies depending on the vertical, CRM experts agree that it requires approximately five to seven touchpoints to close a sale or produce a conversion. Of course, various factors influence touch points, such as price point, competition, and credibility. However, gaining and holding mindshare in a competitive environment demands businesses create touchpoints that are organic and ubiquitous, especially where target audiences spend their time. As a result, secondary platforms such as email and social media platforms, both popular and natural parts of daily activity for many target audiences, are fortuitous additions to marketing channels seeking to drive conversions in the digital domain.
Email Marketing
Email marketing has been the bread and butter of in-house marketers and advertisers since its advent. Sending mass mailings, drip marketing, personalized content–all continue to be popular within a segment of the marketing world. However, contemporary email marketing tools have made sophisticated standalone and supplemental campaigns easier, more effective, and trackable for analytics. Businesses that need to add touchpoints (for long sales cycles, to reactivate a visitor) can do so with ease, adding personalization, key product images and video, and localized special offers. Creating a drip campaign to send over time, and track click/open, bounce, and deliverability provides the business with rich touchpoints tracked back to a CRM.
Social Media
Social media platforms, including Twitter, Facebook, Instagram, and even LinkedIn, all have similar indicators to measure business and competitor performance and tactical implementation. Assessment of the brand’s and its competitors’ social media implementation should include post formats (image, link, text, video), top posting categories (usually the brand, plus contextual categories aligned with the brand’s top products or services), follower count, posting frequency, and finally, post engagement (interactive actions taken in direct response to a post–commenting, sharing, viewing a video, clicking a link, etc.).
Quantitative analysis of these indicators provides a clear tactical mapping for each platform including engagement with the brand, and the likelihood of successful retargeting efforts on respective platform audiences. Similarly, the competitive comparison provides insight into strategy and tactics of top performing companies, allowing the business to gather relevant approaches in the industry, and benchmark against leading tactics.
Building Analytic Capacity
The QMA measures a wide variety of marketing components in order to contextualize a business’s position in the universe. Conducting the assessments requires using a similarly broad set of tools, processes, knowledge and skills ranging from analytics platforms such as Google Analytics, to specialized SEO skills, and finally an integrated data science methodology and discipline that exists in all data-driven companies with longevity and success.
Data Science Maturity
The advancement of data science has transformed marketing from a reliance on gut feelings and complicated but limited statistical analysis to a science that can quantify more market elements than not. The ability to compete in the data-driven marketplace is dependent upon a level of data science maturity that enables the tools, processes, and methodology used for marketing data analytics. From advanced attribution models to the common application of machine learning, marketing departments for business leaders are applying data science to understand customer behavior, build new models, and advance the credibility of the work.
A successful technology-enabled business or marketing department will invest in the platforms–CRM/CDP, ancillary tools designed for high-return tasks, customer analytics and BI front-ends, whether completely off-the-shelf, or augmented in-house. These businesses are currently tracking attribution to match their strategy, all significant marketing efforts are quantified, and the resulting output is accessible and used by team members at multiple organization levels.
The competitive market position of all but a few businesses requires the ability to use complex data capture and analysis–for task automation, for decision-making, for strategic planning. Building capacity for advanced data analytics should now be a part of the business plan.


RESPONSES