

Using a Machine Learning Framework for Search Engine Predictive Modeling
Overview
The interactions between market participants have been fundamentally changed by the evolution of tools and processes of the digital era. Specifically, as buyers and sellers research products and services online, the primary educational platform and conduit for business have become the company website and various forms of content provided to the market from the seller.
According to a 2019 Gartner study, organic search drove over 57% of all B2B desktop traffic and “is the most frequently used digital channel along the entire B2B buying journey”, playing, “a dominant role in the early, middle, and late stages of the purchase process.” Subsequently, because page-one search results receive over 90% of organic search traffic, the advantage of industry-specific intelligence which identifies the variables which can positively influence page-one ranking cannot be understated. And the rules which govern ranking variables have been inferential, opaque, and generalized. However, upon analysis, the factors which produce page-one ranking are far more nuanced, at times contradict generally accepted practice, and are actually industry, competition, and context-dependent.
The goal of this analysis is to study the historically obscured search ranking algorithm for a specific industry, for results that included clear purchase intent. After data collection of ranking factors is completed, the team combines relevant industry experience and statistical modeling best practices to conduct feature engineering and selection, determine the best ML algorithm, and then the final model is subsequently leveraged to compute Shapley Values per variable for each observation. By viewing each observation’s predicted probability as an outcome, game-theoretic Shapley Values are applied to calculate the marginal contribution and magnitude of contribution per variable. These contributions are subsequently interpreted as variable impact on page-one placement. Within this dataset, the top 5 most impactful features are then identified.
It should be noted that the following analysis is idiosyncratic to a specific industry, competitive set, and intent by which search was conducted. Therefore, finding generalizability is confined to the aforementioned context; separate and repeated analyses are critical, not only to applications outside of the target industry but also within the target industry to remain in accord with Google’s dynamic algorithm. That said, an ML framework–engineering features, determining effective algorithms, hyperparameters, training/testing–can be repurposed across other specific industries, competitive sets, and search intent. Each step will likely use or generate different algorithms and values but can be accomplished with similar diligent data science processes.

Machine Learning in Marketing
What it is and why it matters Introduction Machine Learning allows computers to discover underlying ...
Objective of Analysis
Page-one search result placement is determined by proprietary search platform algorithms, yet the relationship between various ranking factors and search engine algorithms is obscured. Google, the largest search engine platform with over 87% market share, provides sparse information on how such factors influence search result placement. This presents a search engine optimization challenge for brands looking to increase website search performance.
A variety of statistical and machine learning methods can be leveraged to mimic the search algorithm and determine top ranking factors for page-one search result placement. However, for any given query or search term, the factors and the magnitude of influence per factor vary. Thus, ranking factor analysis and search engine optimization strategies are industry unique.
The objective of this analysis is to reveal predictive models to forecast page-one search result placement and determine the relative importance of ranking factors for search engine optimization. By understanding the ranking factors based on a set of industry search terms, brands can more efficiently allocate resources to optimize for ranking factors most impactful to page-one search result placement.
Industry Background
Today, when a search is performed, Google instantaneously applies various algorithms to populate the search engine results page (SERP). As part of its collection of search algorithms, Google utilizes RankBrain, a machine learning-based algorithm that helps deliver the most relevant results based on the interpreted search intent. Since its introduction, RankBrain has changed the way organic optimization is carried out, with ranking factor impact being highly intent and industry-dependent.
It is known that the top results of the SERP are attributed to the majority of user clicks and visits; after the first page, click-through-rates (CTR) decline significantly. As the competition for valuable page-one real-estate intensifies through industry growth and new SERP elements such as featured snippets, news, carousels, and FAQs, brands are faced with an organic visibility challenge. Simultaneously, while search industry professionals understand which ranking factors the algorithm likely considers important, the algorithm idiosyncrasies per industry and intent-based search, and constant updates to the search algorithms by Google, add to the complexity of search optimization. Within this context, the following machine learning analysis can be conducted to understand the interactions between ranking factors while predicting page-one v.s. non-page-one classifications.

Understanding Google’s RankBrain
Why it matters 2015 marked a turning point in Google’s search engine history— for the ...
Data & Methodology
Four analysis preparation stages are outlined in the following Data & Methodology section: (1) Dataset Design and Controls (2) Data Collection (3) Feature Engineering (4) Algorithm Training, Tuning, and Selection.
Dataset Design and Controls
Given the analysis objective, the dataset must consider known aspects of Google’s ranking algorithms. To account for the algorithms varying responses to different query types, the analysis requires critical controls to ensure the greatest accuracy from the initial design.
Search Results & Query Design
- Analysis must be contained within a specific industry to minimize bias of ranking factors from other industries.
- Query search volume should be controlled to avoid “outlier” queries with high search volume and potentially different ranking factor weights.
- Finally, even within an industry, query search intent should be homogenous to minimize bias among varying query types (Informational, Transactional, etc.).
Data Collection Controls
- Location controls should be used during data collection to counteract variances in search results and ranking factors between local and national searches.
- To control algorithm ranking differences between devices, data collection should be segmented between mobile and desktop search engine results pages (SERPs).
Dataset Collection
In addition to the controls, data collection choices must align with analysis objective, maintain integrity, and constrain bias.
- To determine ranking factors for page-one placement, data collection focused on web page attributes.
- Positive and negative classes (page-one observations vs non-page-one observations) were balanced for sufficient information distribution.
- Only queries with independent, non-overlapping search results were selected.
Feature Engineering
Following data collection for this example, the initial dataset contained 2,663 URLs (observations) and 32 variables/ features (ranking factors). To prepare the dataset for model training, the following steps are taken:
Missing Value Imputation: The automated nature of data collection from page crawlers and APIs will result in some missing values. However, with a small enough deficiency, a team is able to manually record the missing information without imputation or approximations.
Feature Transformation: High cardinality continuous variables such as “time since last page update” should be transformed to binary dummy variables (e.g., “Updated in last 30 days: Y/N”) to minimize machine load and improve interpretation generalizability.
Feature Selection: While many machine learning methods perform well even in instances of multicollinearity, thoughtful consideration is recommended when selecting which variables to keep/drop when there are strong relationships between the covariates. Measuring the relationships using Predict Power Score (PPS) can capture both linear and non-linear relationships. Features are kept or dropped depending on business actionability, industry knowledge, and the extent of the relationship.
Algorithm Training, Tuning, and Selection
Once the final set of variables is determined, the dataset should be randomly split into training and testing datasets (e.g., 70/30). Model training is done solely through the training dataset, while the testing dataset is withheld for performance evaluation. This methodology protects against over-fitting issues during model training, improves finding generalizability, and allows for true predictive performance evaluation between models.
Initial algorithm selection should be based on the analysis objective: to determine the impact of ranking factors on whether or not a result would be placed on page one of the SERP. Given the binary dependent variable, the following classification machine learning algorithms can be applied to the training dataset:
- Logistic Regression
- K-Nearest Neighbor
- Support Vector Classifier (SVC)
- Decision Tree
- Random Forest
- XGBoost
The performance of each machine learning algorithm can be evaluated with 10-fold cross-validation across 20 hyperparameter optimization iterations. Testing is repeated 100 times to validate stability across samples. The optimal hyperparameter configuration is used to train the model and estimate Shapley Values as a measurement of variable impact on page-one probability.
Results & Findings
Repeated hold-out test sample evaluation conducted across 100 different training and testing splits assess algorithm performance and stability. The example’s average and standard deviations of each algorithm across the 100 iterations of training/testing samples are below.
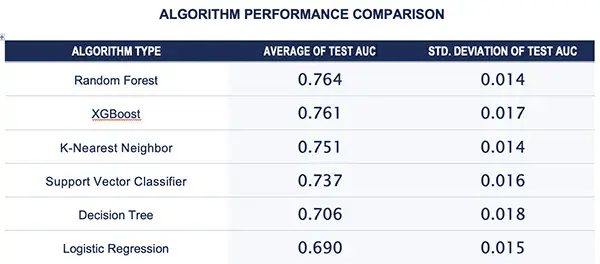
In this analysis, on average, the Random Forest algorithm outperformed all other algorithms, indicating it to be the ideal classifier for this task. Based on this information, 10-fold cross-validation across 50 hyperparameter iterations can be conducted on the full dataset.
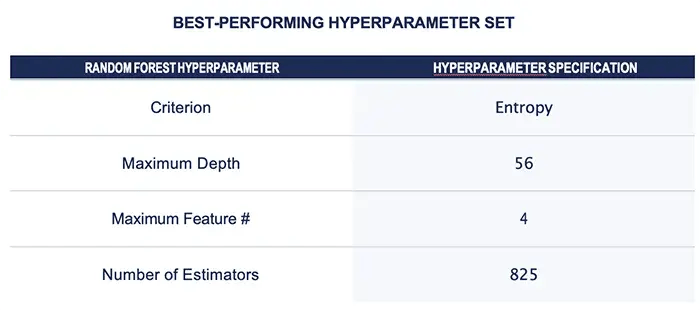
The highest performing hyperparameter Random Forest configuration is applied to the full dataset to generate the final predictive model. To understand the relative importance of ranking factors included in the analysis, Shapley Values per variable are calculated to gain insight into the top ranking factors for page-one placement.
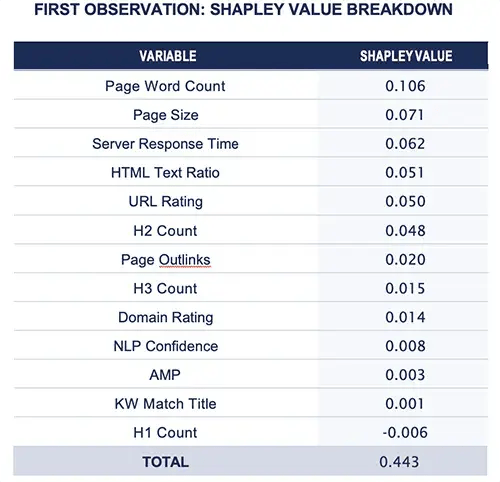
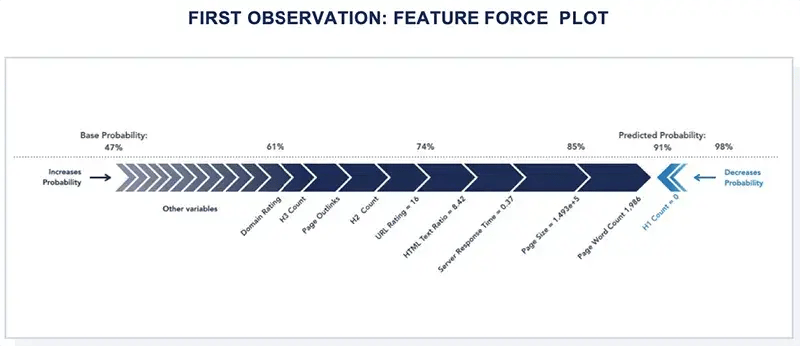
The use of Shapley Values can be illustrated through an example. Based on the final Random Forest model, the first observation’s predicted page-one probability is approximately 91%. The average predicted page-one probability across all observations is approximately 47%. The difference between the two probabilities (91% – 47% = 44%) is deconstructed in the following Shapley Value breakdown for the first observation.
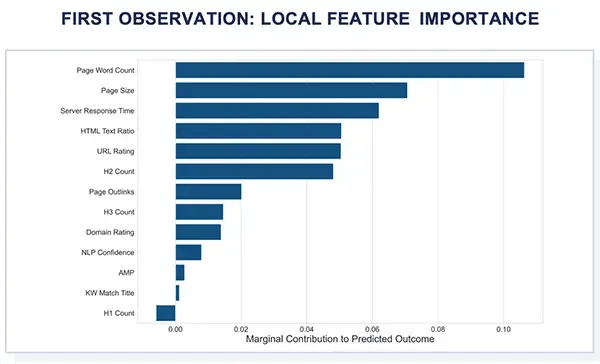
An alternate way of visualizing the Shapley Value breakdown for the first observation’s prediction is through the following bar chart. Page Word Count, Page Size, and the Server Response Time are the top three features contributing to a higher page-one probability, while the number of H1 tags is the only feature detracting from page-one probability.
The following visual helps contextualize the first observation’s Shapley Values per variable with its raw feature values. Notice that the features with positive Shapley Values (as indicated above) are increasing page-one probability, while the features with negative Shapley Values (as indicated above) are decreasing the probability of page-one.
While the illustrations above reveal local feature importances per observation, Shapley Values can also be utilized to visualize global feature importance. To determine the overall impact of the variable set on predicted probability, the Shapley Values of each observation can be absolute valued, averaged per variable, and then sorted by descending order.
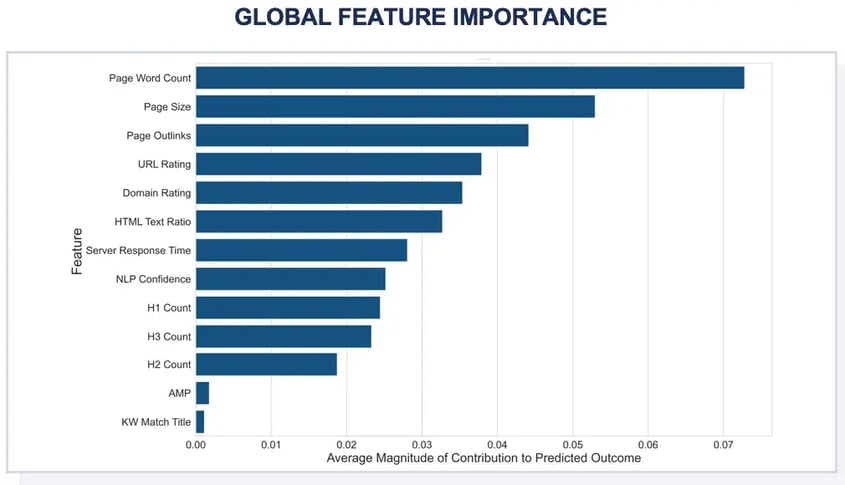
As shown, the most impactful features on page-one probability are Page Word Count, followed by Page Size, Page Outlinks, URL Rating, and Domain Rating.
Keyword Homogeneity
One of the most impactful controls considered during analysis preparation is query sets that are homogenous in search intent, or in practical terms, keywords perceived with homogenous intent by the search algorithm. If different queries within the dataset are asking a subtly different question (e.g., a different query intent), the model becomes imprecise.
For example, if the goal is to quantify ranking factor importance for an office space realtor, keywords related to “office space” would be an included relevant query. If related terms such as “shared office space”, “shared workspace”, or “coworking space” were included, the impact on a model’s ability to predict page one probabilities can be impacted. While the audiences for the different keywords may overlap, the subtle differences might interact differently with Google’s algorithm, resulting in different search results, thus ranking factors may be moderately different. To illustrate this point, the above analysis was conducted first with a full dataset including related but with slightly different intent denotations; then conducted again with the more intention-restricted dataset. The result was a nearly 10-point increased predictive value in the restricted dataset.
Removing closely-related but “outlier” queries will not always create this degree of model improvement. Nonetheless, for a specific dataset, an increase in performance suggests that a more granular approach could yield better results for the industry, which emphasizes the fact that it is necessary to create personalized strategies that are easily adaptable to the idiosyncrasies of a given market.
Conclusion & Recommendations
Machine learning implementation affords brands greater transparency into search ranking algorithms. The purpose of this analysis was to mimic Google’s search algorithm for the keyword universe of a specific industry to inform budget allocation, marketing strategy, and additional experimentation moving forward.
The final Random Forest model in the analysis example was able to accurately separate page-one from non-page-one observations approximately 77% of the time, and ~86% for the more homogeneous dataset. The former with the top 5 most impactful features being (1) Page Word Count (2) Page Size (3) Page Outlinks (4) URL Rating and (5) Domain Rating, and the latter with the top 5 most impactful features being (1) Page Word Count (2) Page Outlinks (3) H1 Count (4) Domain Rating and (5) Page Size. As mentioned, this set of top-ranking factors is limited to the target industry, competitive set, and search intent; in a similar analysis conducted for a separate industry, the top-ranking factors were found to be entirely different, predominantly focused on features pertaining to Page Speed. With different key contextual attributes (e.g., industry, competitive set, intent), the relative importance of various ranking features changes.
While machine learning methodologies do not allow explicit causal links to be drawn between page-one placement and ranking factors, the following insights can be derived from the example analysis results:
- Page Word Count can be considered as one of the many indicators of page content richness. With Word Count being the most impactful feature, this may indicate that within this industry, and within the context of the observed intent-based searches, thorough and informative pages are prioritized by the search ranking algorithm. Thus, brands who seek to increase the probability of page-one rank for this type of search would increase Page Word Count by focusing on content depth and value.
- As with Word Count, Page Size can be interpreted as an indicator of content richness. However, the relationship between Page Size and page-one probability is nuanced; most observations with Page Sizes between 0.4 and 0.7 kilobytes have positive Shapley Values, implying that there may be diminishing return for Page Size on marginal contribution on page-one probability once Page Sizes increase beyond that range. There is an inherent trade-off between Page Size and content richness, thus, the right balance should be found through experimentation.
- Page Outlinks is also a high ranking variable. Leveraging domain expertise in the industry, it is known that pages with high numbers of Page Outlinks as well as high Word Count (another highly-ranking factor) are likely aligned with directory pages that have multiple industry listings. Such results tend to rank well in SERPs; given the wealth of content and relevant links provided on-page, users are likely to spend more time on the page and less likely to return to the search page, which holds implications for user experience.
- URL Rating indicates the popularity and authority of a page based on the number and quality of links from other domains (backlinks/referring domains). This is a primary factor of the known PageRank algorithm. Observations with URL Ratings below 10 demonstrate decreased contributions to page-one probability; therefore, active implementation of outreach campaigns to acquire relevant backlinks and referring domains to build authority directly to target pages is recommended.
- Adjacent to URL Rating, Domain Rating measures the popularity and authority at a domain level. While higher Domain Rating suggests higher authority, it should be noted that authority is measured by domain topic. Within the given industry, it appears that there is a diminishing return for Domain Rating on marginal contribution to page-one probability. Provided the magnitude of impact on page-one probability for Domain and URL Rating, it is advised to focus more resources to bolster page authority.
As the digital ecosystem, and organic search, in particular, continue to perform a vital function for consumers and businesses, the competitive demands of digital competence will continue to increase. Using machine learning models to analyze and measure the most profitable optimization factors from a complex and often contradictory set of variables can be a significant tool for businesses and SEO professionals.


RESPONSES