SHARE


Reports
After migrating and recreating your UA configuration components, continue to map out your data requirements with the extensive reporting options in the new platform. Standard analytics reports provide customizable at-a-glance dashboards of your KPIs. The exploration templates support highly configurable analysis models to dive into visitor behavior across different buyer journeys. And the AI-enabled anomaly detection provides automated and customizable insights.
Key Tasks
- Customize standard reports to monitor critical KPIs
- Configure and experiment with exploration templates
- Use explorations to examine user behavior, paths, cohorts, and funnel analysis
- Access and use anomaly detection
- Create custom insights
 GA4 Home page
GA4 Reporting Overview
GA4 is designed to make core KPIs instantly accessible and surface insights quickly and efficiently, while also providing the advanced tools that analysts can use to explore data aligned with the business model. The platform provides multiple interfaces to data, including pushing standard KPIs and data-based insights, and enabling detailed experimentation with advanced data analysis tools and templates.
Key interfaces to data analytics include:
- The Home Page includes a report snapshot including the most relevant KPIs with high-level overviews and quick drill-down detail reports, all driven by your behavior in GA.
- Standard Reports provide expected and necessary overview and detail reports based on phases of the customer life cycle.
- Explorations enables advanced path, cohort, and funnel analyses through a set of highly configurable templates.
- Anomaly Detection is the AI-driven statistical technique used to identify anomalies in both time-series data for specific metrics and within segments at specific points in time, driving automated and customized insights.

The Home Page
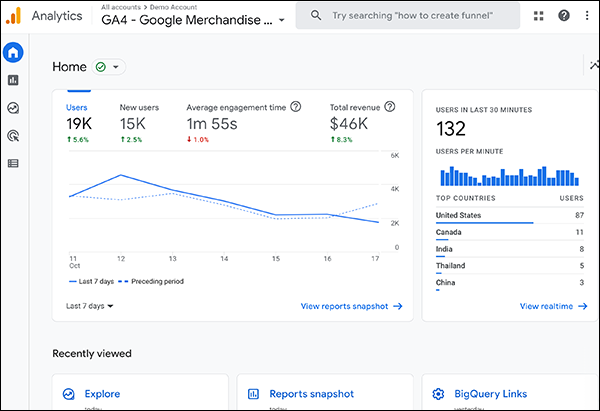
The GA4 Home page is expectedly data- and user-centric, displaying sets of relevant data customized to your behavior in GA. From the various analysis cards and displays, users can navigate across the platform from the links presented in the overviews and snapshot reports, the row of recently viewed analytics destinations, or the left menu.
The included Overview card displays the metrics most relevant to you, such as active users, new users, and revenue metrics along with a trend line. Clicking any of the overview card tabs refreshes the trendline data, and a mouse hover displays data points at any date in the shown time period. The bottom of the card allows changing the time period or viewing the complete reports snapshot. Any overview report can be configured as the reports snapshot by simply selecting a report in the Reports Library and choosing "Set as Reports snapshot" from the More [⋮] icon. Alternatively a custom reports snapshot can be assembled using the report builder.
The Realtime card shows current user activity over the last 30 minutes, with source countries and a link to the full realtime report.
The Recently viewed section displays links to areas of the platform most recently visited. Whether to other reports, the Admin page, the recently viewed row provides quick links, and expands to hold additional scrolling links capturing your recent analytics activity.
The Insights and recommendations section shows any unusual changes, trends, or other insights about your properties. Each insight is labeled as an organic insight, or a custom insight set up by a user. The insight header captures the key anomaly, followed by a visualization to illustrate the data point deviation. Each insight can be opened individually, or viewed together by clicking "View all insights."
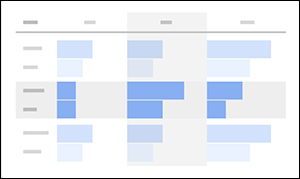
The Standard ReportsWhile users can explore data in hundreds of ways in the new platform, many of the core KPIs are found in the predefined standard reports. Standard reports are distributed across the Acquisition, Engagement, Monetization, and Retention life cycle. Additional user-focused reports are displayed below the life cycle in the Demographics and Tech sections. Each expanded section includes an overview report and multiple detail reports. For example, the Engagement section includes an Engagement overview, then detail reports for Events, Conversions, Pages and screens that reveal specific engagement dimensions. |
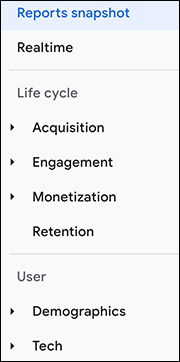
|
Customize and Use Standard Reports
Both the standard overview and detail reports within the Life Cycle and User collection can be customized to some degree.
Overview Reports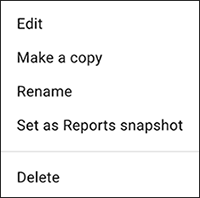
Overview reports are assemblies of different summary cards (which are defined in detail reports). Customizing overview reports allows you to add, subtract, and move the different summary cards, or unlink from a report template. Note, linked reports receive updates from Google. For example, if a new dimension is added to the Engagement Overview report, any reports customized and linked will receive the new dimension. You can also set any overview report to be the Reports Snapshot that is displayed on the Home page.
|
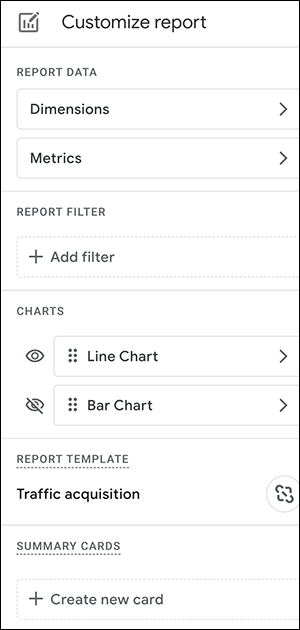
Detail Reports Detail reports can be customized with all parameters below. Report Data: includes the dimensions and metrics that can be available in the table. For example, clicking on the primary dimensions in the report builder for traffic acquisition could show session sources, session medium, session source platform etc. Metrics could show the users, sessions, events per session, etc. Dimensions and metrics can be dragged to the preferred order. Report Filter: allows you to filter a subset of the data by dimension. For example, a filter could limit by platform. device, or source. Charts: Each detail report can contain up to two visualizations, such as a bar chart or scatter chart. Either one or both can be toggled on or off, or dragged to the preferred order. Report Template: just as in overview reports, the detail reports can be unlinked from the template and unavailable for any Google updates. Summary Cards: allows you to build related summary cards that can be assembled to overview reports. Each summary card must have at least one dimension, metric, and visualization. Only those dimensions and metrics used in the detail report are available. |
|
What are Explorations?
In addition to the standard predefined reports available, the Explorations menu offers a set of exploration templates allowing more sophisticated data explorations, allowing deep dives into prospect and customer behavior.
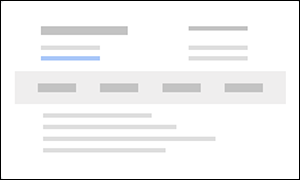
Free-form explorationView data in a traditional table layout, arranging and comparing metrics in rows and columns, or using other visualizations such as bar or pie charts, and scatter plots. |
Free-form exploration
|
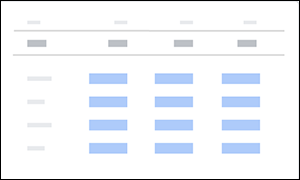
Cohort explorationExplore behavior and performance of groups of users who share a common characteristic of an analytics dimension. For example, observe different groups with a common acquisition date over time. |
Cohort exploration
|
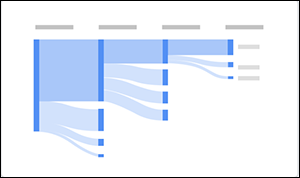
Funnel explorationAnalyze performance of users across a predefined path or customer journey steps, visualizing how users achieve or fail in the sequence. |
Funnel exploration
|
Segment overlapGain unique insight into how different user groups relate to each other by adding 3 segments across dimensions. Isolate otherwise hidden unique audiences based on complex conditions. |
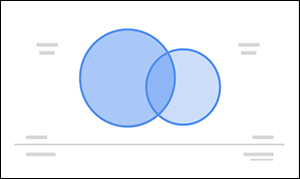
Segment overlap
|
User explorationExplorer groups or individual users through different dimensions and metrics, using filters and segments, and examine with different visualizations. Drill down to detailed information about a user's acquisition or timeline to uncover insights. |
User exploration
|
Path explorationVisualize issues and optimization opportunity based on user interactions and activities that precede or prevent conversion. Unlike the funnel exploration, the path is open-ended, uncovering multiple paths to a specific endpoint. |
Path exploration
|
User lifetimeComparing how different users behave over their lifetime as a site or app user can identify highest valued channels, user profiles, or paid campaigns for a business. Comparisons can include multiple dimensions across business priorities. |
User lifetime |
Configure and Use Explorations
The standard analytics reports help you track KPIs across phases of the customer life cycle, from acquisition to retention, and the customizations help you focus on preferable subsets or views.
Explorations, however, provide tools that access data with techniques unavailable in standard reporting. The explorations editor is composed of 3 distinct sections from left to right: variables, tab settings, and the report canvas. While each exploration type or template varies slightly, the general layout is the same.
| VARIABLES | TAB SETTINGS | CANVAS |
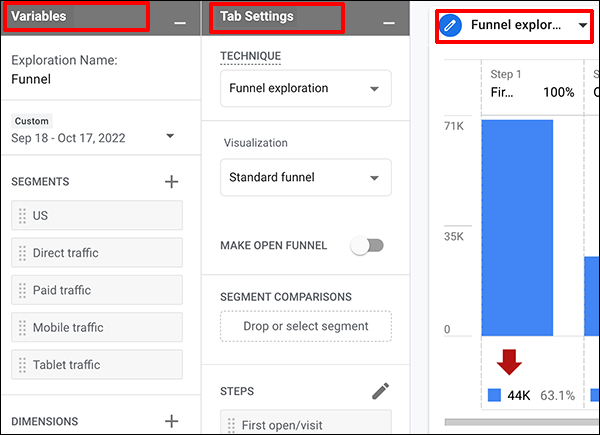 The Explorations Editor
Variables
The left panel is where you select segments, dimensions, and metrics, as well as the timeframe for your exploration. You can also name the exploration for sharing here.
Tab settings
The middle panel is used to configure the currently selected reporting tab displaying the exploration. An exploration can have up to 10 visualizations in separate tabs. Within the top of the panel, select the exploration technique, and visualization options. The bottom half of the panel configures the breakdown, or the elements that customize the exploration. For a Funnel exploration, these include steps and rows of dimensions. For a Cohort exploration, these include cohort inclusion and return criteria, cohort granularity, and the type of calculation used.
The Canvas
The large display area on the right displays your data and configuration using the technique selected, in up to 10 visualization tabs. Either or both of the left columns (Variables, Tab Settings) can be minimized to provide more room for the visualization in the Canvas area.
Exploration Use Cases
As you become more familiar with the components of the explorations editor, you will be able to apply different templates to specific business practices, gaining views of user behavior and cohorts otherwise impractical. The exploration editor allows analytic-minded users to dive into areas of responsibility and critical business importance.
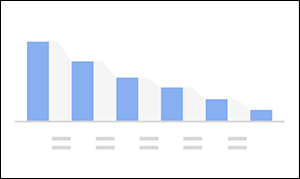
Path Exploration: identify issues and optimization opportunities
Path exploration allows you to analyze components of customer journeys by revealing activities preceding conversion, obstacles preventing conversion, and solutions that accelerate the buyer journey.
A Path Exploration is a tree graph, illustrating a sequence of events triggered and pages/screens visited by a user.
Because this exploration is open-ended, you can view behavior across multiple paths to different desired endpoints. You can surface issues and opportunities for optimizing journeys, whether for subscribing to a newsletter, downloading a white paper, submitting contact information, or moving items from a wish list to a checkout cart.
For example, a business may want to identify what customers do after they begin an online purchase. With Path Exploration, simply choose the starting point for your path. In the Path Exploration template, choose an event such as add_to_cart, or further along at begin_checkout.
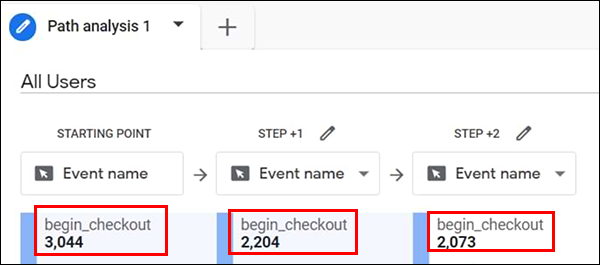 Path Exploration at begin_checkout
If the path shows multiple simultaneous firings of the begin_checkout event, a tagging issue is present. In this example, multiple tags are all firing and sending multiple checkout events to the property. This can occur when a developer migrates pages and duplicates tagging by accident. For a detailed example using the Google GA4 Demo site, check this step-by-step post from AnalyticsMania.
Use the Path Exploration to:
- Identify any common events that repeat, showing a user getting stuck or lost
- Identify effects of specific interactions or events on a user's following actions
- Identify shortest and longest conversion paths to find optimization points (reverse path)
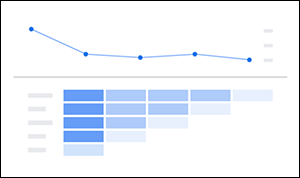
User Lifetime Exploration: identify highest value in the next 28 days
Like other highly configurable explorations, the User Lifetime exploration has nearly unlimited configurations to answer specific business questions. Find which traffic source provides users with the highest lifetime value? Which active campaigns are expected to be the most valuable? What behaviors appear common for users with highest lifetime value?
For example, a business wants to measure the first user source with the highest short-term transaction value. Using the User lifetime exploration with First User Source for the rows, adding from suggested segments "Predicted 28-day top spenders."
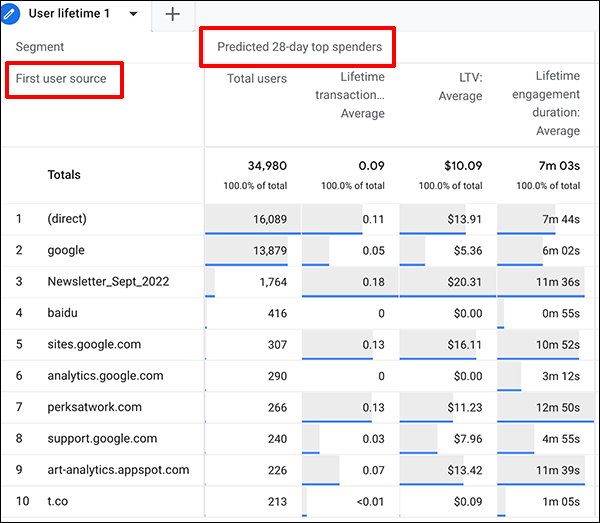 User lifetime: 28-day LTV Prediction
The User lifetime exploration shows total users and LTV average by first user source. As a result, the business can see where highest (short-term) value comes from in aggregate and by user average. In this case, response to the recent newsletter is strong, but dwarfed by volume of Direct and Google.
Use the User Lifetime Exploration to:
- Identify paid campaigns driving users of greatest lifetime value compared to monthly revenue
- Identify engagement correlation with LTV for each property
- Compare LTV with most recent interactions to measure current interactions
- Compare predictive metrics for purchase, in app purchase, and churn probabilities against specific key business dimensions to measure dimension value
Exporting Explorations
Data from explorations can be shared or exported in the following formats:
- Google Sheets
- TSV (tab separated values)
- CSV (comma separated values)
- PDF (all tabs)
Reporting and Exploration Limits
Limits for the standard GA4 properties as documented in Google support articles.
- Overview customizations are limited to 150 custom reports per property.
- Detail report customizations are limited to 200 custom reports per property.
- Individual explorations are limited to 200 per user per property.
- Shared explorations are limited to 500 per property.
- You can apply up to 20 segments per exploration.
- You can apply up to 10 filters per tab.
- You can apply up to 20 dimensions and 20 metrics to an exploration.
- Each exploration can contain up to 10 visualizations.
Anomalies and Insights with GA4
GA’s approach to automating insights follows the same blended model as the overall approach to reporting: push information to the user but provide tools to allow the users to drive further.
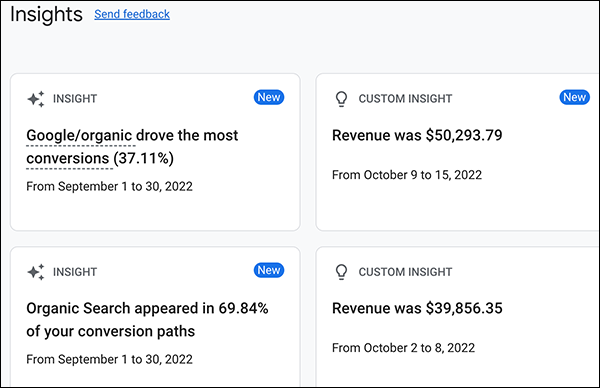 Insights Cards
GA4 provides anomaly detection in metrics over time-series data to predict values and observe deviations. The anomaly detection also can view multiple metrics and dimensions at a single point to flag anomalies. Both approaches, explained in more detail here, drive automated insights to your dashboard. However, in addition to this automatically displayed actionable information, custom insights are possible using the same system.
Drilling into infinite combinations of data takes time beyond small team capability. The machine-learning of GA detects patterns and anomalies rapidly, needing only the volumes of data required to mine. As a GA4 user, you reap the benefits from insights that are improbable to detect with unaided team resources. The small time required to set up custom anomaly detection is well-worth the investment.
To create a custom suggested insight:
- On the insights card, click View all insights.
- To use a suggested insight, select the check box for each insight you want to create, then click Create selected.
- Then complete the modify and save process.
To create your own custom insight
- Under Start from scratch, click Create new.
- Set the condition that generate the insight:
- Elevation frequency
- Select segment
- Select metric
- Name the insight, manage who sees and where they see it.
- Click Create.